Observations about the GOV2 TREC data set
Kevin S. McCurley
IBM Almaden Research Center
The TREC competition in information
retrieval recently collected a data set called GOV2 that was derived from
a partial crawl of the part of the web representing the US government.
Regrettably, the data set is not freely available for research,
but at least I am allowed to publish some statistics about it.
First, I've dealt with many other data sets from web crawls, including the
IBM intranet and a
multi-billion page crawl of the World Wide
Web. Whenever studying one of these data sets, I always wonder if they
are representative of other web structures, or whether they display some
idiosyncracy of my crawler or the corpus itself. It's good to know that
the TREC GOV2 data set shares many characteristics of others that I have
worked with. Some basic statistics about the GOV2 data set are given
at CSIRO.
Here are some additional observations and statistics:
- URL distribution
- Links and degree distribution
- Host links
- Content size
- Content age
- Number of title and anchortext terms
URL distribution
The GOV2 data set consists of a snapshot of the resources fetched from
25,205,179 individual documents from 17,186
distinct hosts. Note that there are duplicate URLs in the collection
(7,655 of them), apparently corresponding to different crawl events on
the same URL. In spite of the name for the data set, not all of
the URLs are from the .gov domain.
Here is a breakdown of the top-level domains for the URLs:
Top level domains represented in the collection
| Domain | host count | URL count |
|---|
| .gov | 13214 | 22,905,929 |
| .us | 3941 | 2,278,538 |
| .com | 18 | 11,089 |
| .org | 11 | 3,850 |
| .mn | 1 | 90 |
| .net | 1 | 5,683 |
| Total | 17187 | 25,205,179 |
|---|
The .com domains appear to be related to government:
| domain | number of URLs |
|---|
| www8.myflorida.com | 5540 |
| www.youroklahoma.com | 1213 |
| www.discoveringmontana.com | 1157 |
| discoveringmontana.com | 928 |
| www11.myflorida.com | 833 |
| my.ncgov.com | 423 |
| www.ncgov.com | 376 |
| www.kysos.com | 241 |
| www.myscgov.com | 223 |
| www.nctraining.ncgov.com | 132 |
| discovernd.com | 9 |
| ncgov.com | 6 |
| myscgov.com | 2 |
| www.ccncgov.com | 2 |
| search2.discoveringmontana.com | 1 |
| search.ncgov.com | 1 |
| calendar.ncgov.com | 1 |
| contracts.ncgov.com | 1 |
| Total | 11089 |
|---|
The number of URLs per host has been observed to follow a
lognormal distribution. This is reflected in the GOV2 data set
as well.
| The number of URLs per host. |
|---|
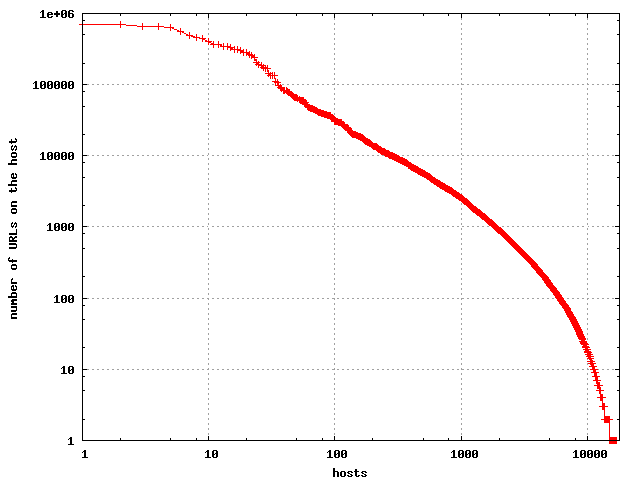 |
This is in close agreement to what was reported in
a paper describing observations
on the web at large.
It's clear that a few hosts have most of the URLs, and the
cumulative distribution is given below.
| The cumulative distribution of number of URLs per host. |
|---|
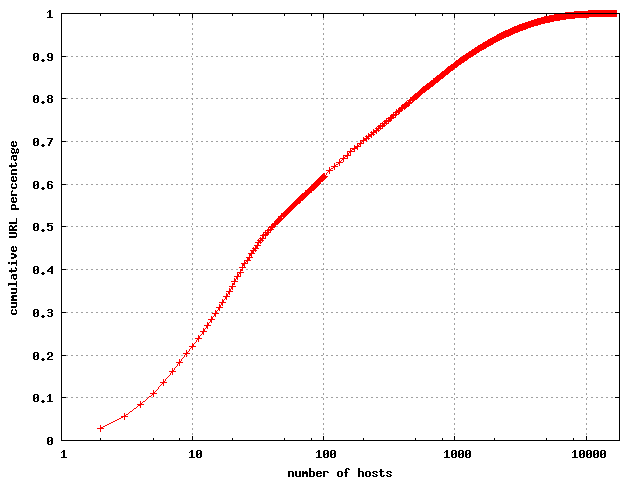 |
Note that 100 hosts account for 61% of the URLs, and 1000 hosts account
for 87.8% of the URLs. Since the data set covers 17,186 hostnames, it's
clear that most of the hosts contribute almost none of the URLs. This
is common in most crawls, and might be even more pronounced for the large
numbers if it were not for crawling limitations. Because a crawler is
typically limited in the number of URLs it can fetch per hour from a server,
this effectively caps the number of URLs that can be observed from a site
during a given time frame.
Some database-driven sites have an essentially unlimited number of URLs.
Links and degree distribtion
The data set consists of the 25,205,179 individual documents (25,197,524
nonduplicated URLs), plus the records for 833,795 HTTP redirects, of which 28
were duplicates. Some of this data is inconsistent - for example there are
records that indicate the page with document ID GX243-38-13543987 (URL http://greenwood.cr.usgs.gov/energy/OF01-167/OF01-167_text.pdf) was crawled and gave
content, but it is also listed as a 301 redirect to
http://pubs.usgs.gov/of/2001/ofr-01-167/OF01-167_text.pdf in the HTTP
redirects file.
Once I parsed the documents, this produced a set of 933,201,851 individual
links.
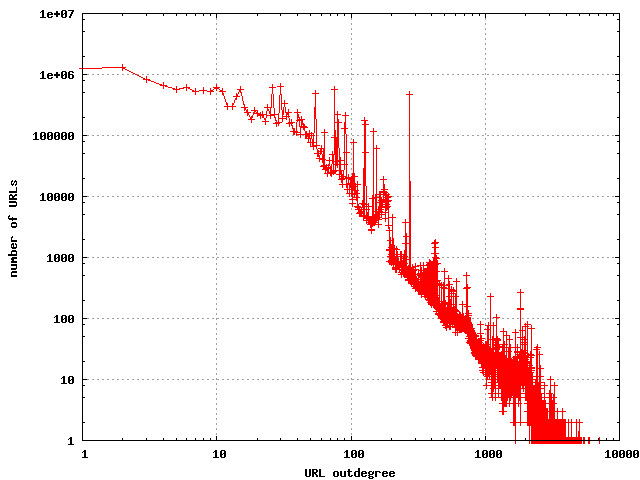
The outdegrees of web pages have been well studied, and the outdegrees
of this data set seem to be consistent with previous observations, with
a few minor differences. First, the average outdegree was found to be
37.02. This is slightly higher than has
been observed in the past, but
partly due to the increased use of templates for a common look and feel
across sites. The parser used for extracting links recognizes <link>,
<a>, <meta refresh>, and <area> tags. A large number of
links are now appearing as javascript, and these are not recognized by
my parser. If these were to be included in the count it would inflate
the numbers even more.
The distribution of outdegrees in the URL link graph
 |
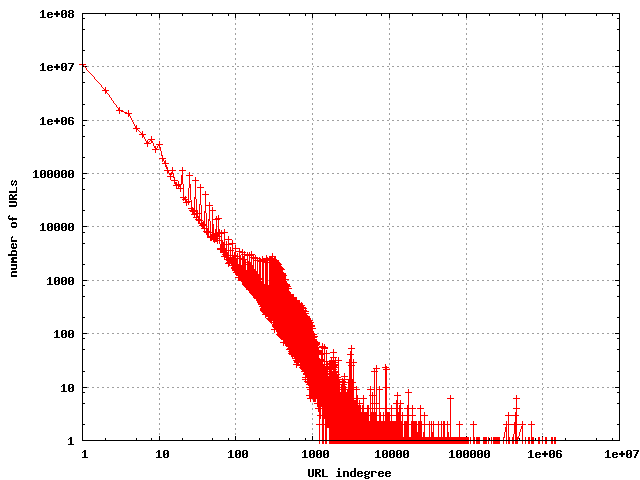
The indegrees have been observed to have a nearly pure power law distribution,
and that is what I found for this data set.
The distribution of indegrees in the URL link graph
 |
The hostlink graph
The hostlink graph consists of a node for each host, and a directed edge
from host A to host B of weight w if there are w URLs on A that link to
some URL on B. This aggregated link graph provides a convenient way of
thinking about the relationship between individual subcollections in the
overall corpus. Of the 17,186 hosts in the data set, I found outlinks from
URLs on 15,890 of the hosts. There were 440,777 distinct hosts that were
destinations in the hostlink graph, which represents the
"frontier" of the hostlink graph for
this crawl. By contrast, our crawl at Almaden has discovered approximately
120 million hostnames on the World Wide Web, but most of these appear
to be for the purposes of link spam on the hostlink graph. One appealing
aspect of studing the .gov domain is the apparent lack of spam.
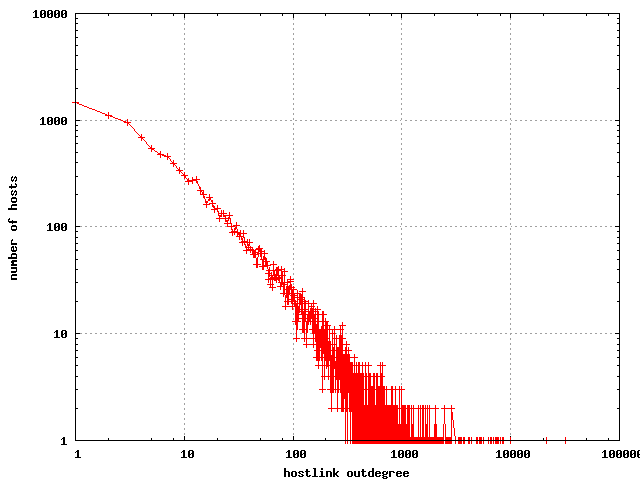
The hostlink graph has somewhat higher degrees than the ordinary link
graph.
The distribution of outdegrees in the hostlink graph
 |
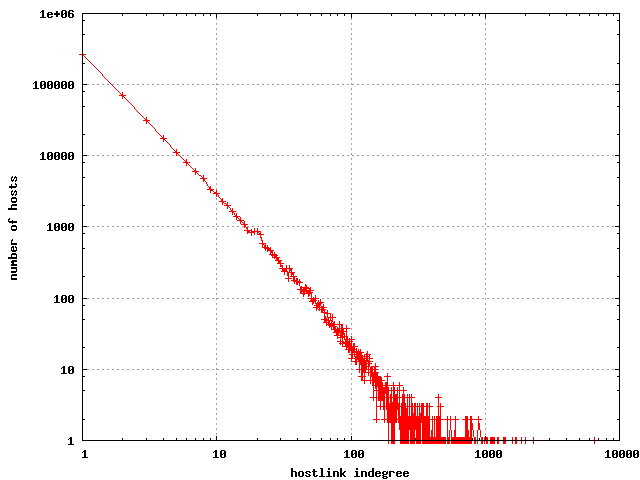
The hostlink indegree looks similar to the link indegree, and is quite
accurately described with a power law distribution.
The distribution of indegrees in the hostlink graph
 |
The hosts that have the most links to them are as follows:
| Hosts with highest indegree |
|---|
| www.adobe.com | 6530 |
| www.epa.gov | 2293 |
| www.microsoft.com | 2002 |
| www.whitehouse.gov | 1852 |
| www.cdc.gov | 1707 |
| www.firstgov.gov | 1683 |
| www.nasa.gov | 1603 |
| www.access.gpo.gov | 1594 |
| www.census.gov | 1407 |
| www.usda.gov | 1392 |
| www.usdoj.gov | 1377 |
| thomas.loc.gov | 1253 |
| www.nps.gov | 1247 |
| www.house.gov | 1244 |
| www.usgs.gov | 1233 |
| www.fema.gov | 1171 |
| www.nih.gov | 1151 |
| www.doi.gov | 1149 |
The results are somewhat different if we count indegree by adding
the corresponding weights.
| Total host indegree weight |
|---|
| es.epa.gov | 19504852 |
| nihlibrary.nih.gov | 10637258 |
| www.nps.gov | 6478052 |
| www.epa.gov | 4597968 |
| www.nlm.nih.gov | 4116697 |
| www.usgs.gov | 4034763 |
| agdcftp1.wr.usgs.gov | 2684677 |
| www.srs.fs.fed.us | 2328013 |
| www.reserveusa.com | 2324941 |
| forestservice.custhelp.com | 2323862 |
| geo.arc.nasa.gov | 2203180 |
| www.nih.gov | 2161469 |
| www.ornl.gov | 1871501 |
| www.firstgov.gov | 1724054 |
| computing.ornl.gov | 1316197 |
| frwebgate.access.gpo.gov | 1282437 |
| www.doi.gov | 1221853 |
| search.leg.wa.gov | 1158824 |
| www.ourdocuments.gov | 1089217 |
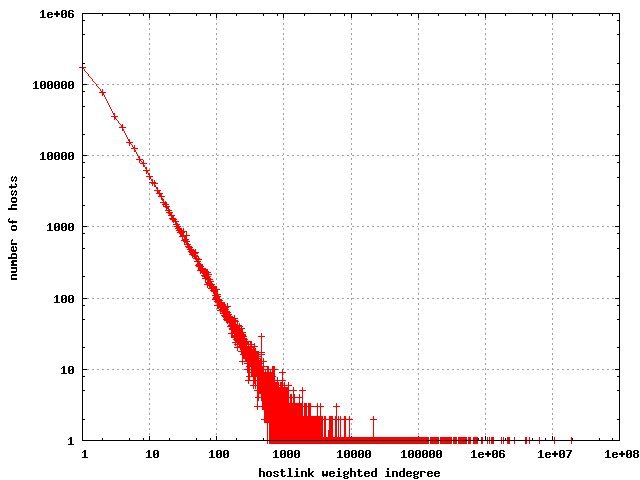
The distribution still looks about the same (although the raw
numbers are obviously larger).
The distribution of weighted hostlink indegree
 |
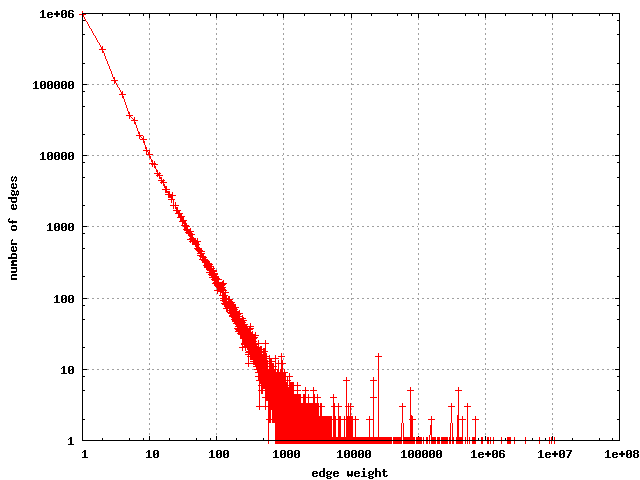
The distribution of weights on the edges of the hostlink graph
are shown below: Note the nearly linear relationship on the log-log plot.
The distribution of weights on the edges in the hostlink graph
 |
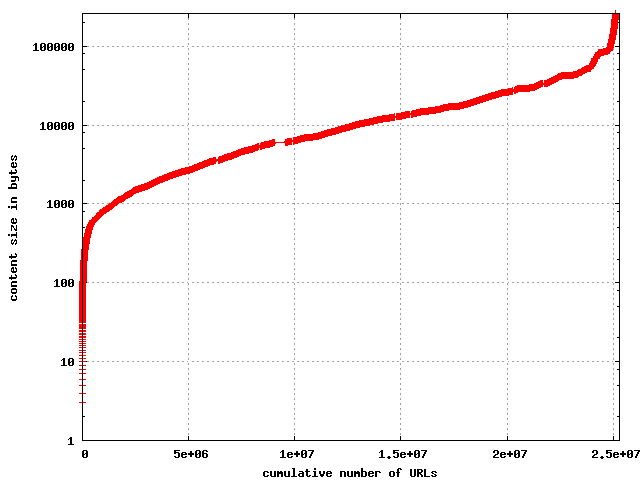
Number of bytes per resource
The resources in the collection were truncated at 256K, but it turns
out that only a few hundred appear to have been truncated. Most resources
fall between 1,000 and 25,000 bytes.
The cumulative distribution of content size
 |
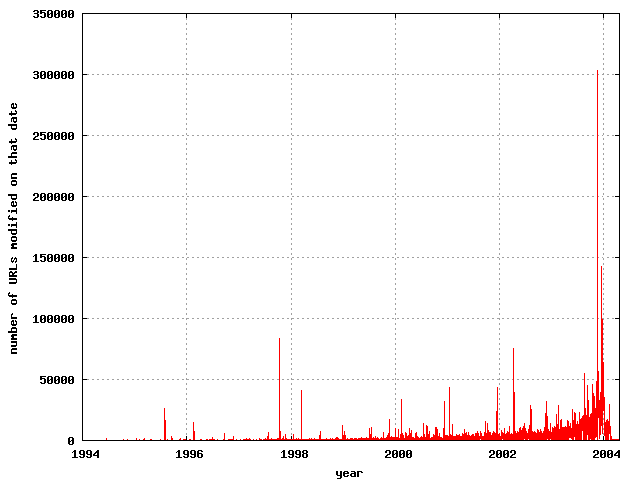
Age of content
The HTTP header specification allows a server to return the
Last-Modified:, which is supposed to represent the date at which
the content was last modified. This field is notoriously unreliable for
accurate trend statistics, as evidenced by the fact that one of the
documents was reported to have been last modified on
Mon, 06 Feb 2040 10:03:18 GMT and another on
Wed, 17 Dec 1902 22:59:21 GMT. Discarding some obviously crazy
values, it's still interesting to see the
distribution of these as reported by the server. Just under 10 million
of the 25 million URLs returned Last-Modified header fields.
The distribution of last-modified days
 |
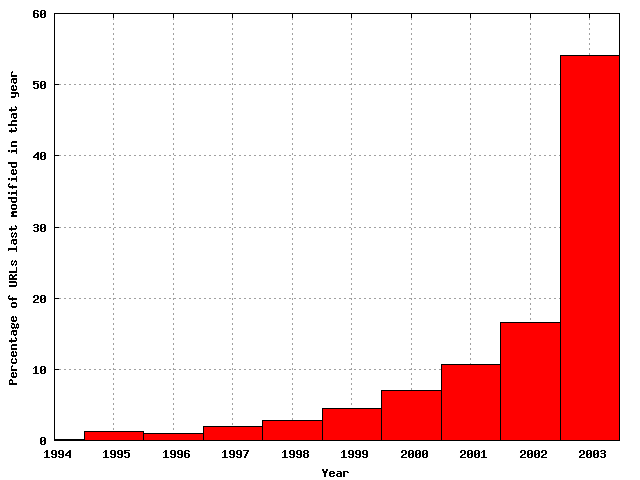
Bucketing by year is more predictable:
The distribution of last-modified years
 |
Finally, the cumulative distribution function is perhaps more enlightening.
The cumulative distribution of last-modified dates
 |
Number of terms in title and anchor text
The title is a very useful feature for indexing of documents, although
anchor text has usually been more useful for the home page finding task
in web search engines. This shows the distribution of the number of
terms in the title for the documents in the collection.
The distribution of the number of terms in titles
 |
The distribution of the number of terms in individual anchor texts
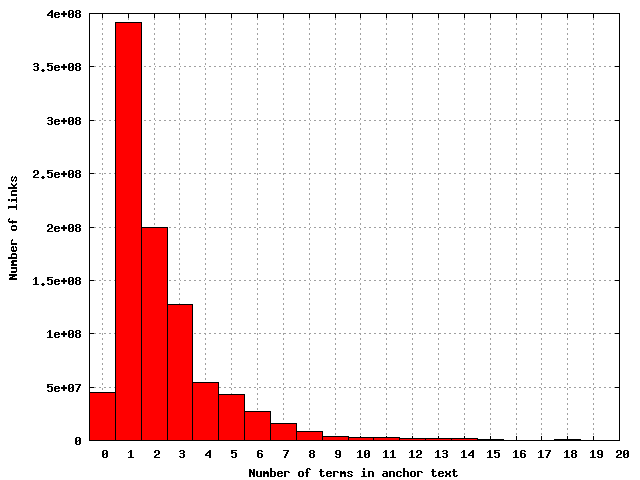 |
The discrepancy in the shape of the distribution for title terms confirms
something that I've been suspicious about for a while now - titles are a
notoriously noisy information source, particularly for indexing. The
statistics on the lengths of titles are probably distorted by some artifact
of 9-term titles generated by a database.